When I was a student, the only way of requesting information from student families was by using paper notes. In many schools today, that is still the case and the number of forms is ever increasing as the demands on schools to capture information grows.
At Canberra Grammar School, an ongoing project is transforming paper forms into electronic forms, and making quite a difference to the way the school operates. The School uses a proprietary form system called Infiniti from Intelledox, an Australian company based in Canberra, but the benefits could be seen using any forms system, even HTML forms.
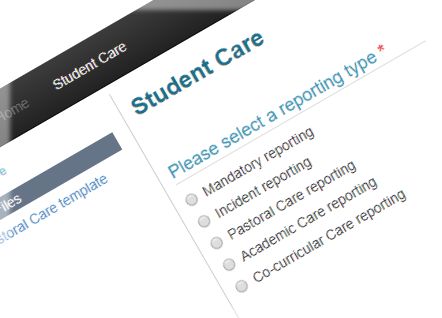
The forms system is being used to collect information from families and staff. Coupled with an electronic announcements system, this has changed the way the School requests and collects information.
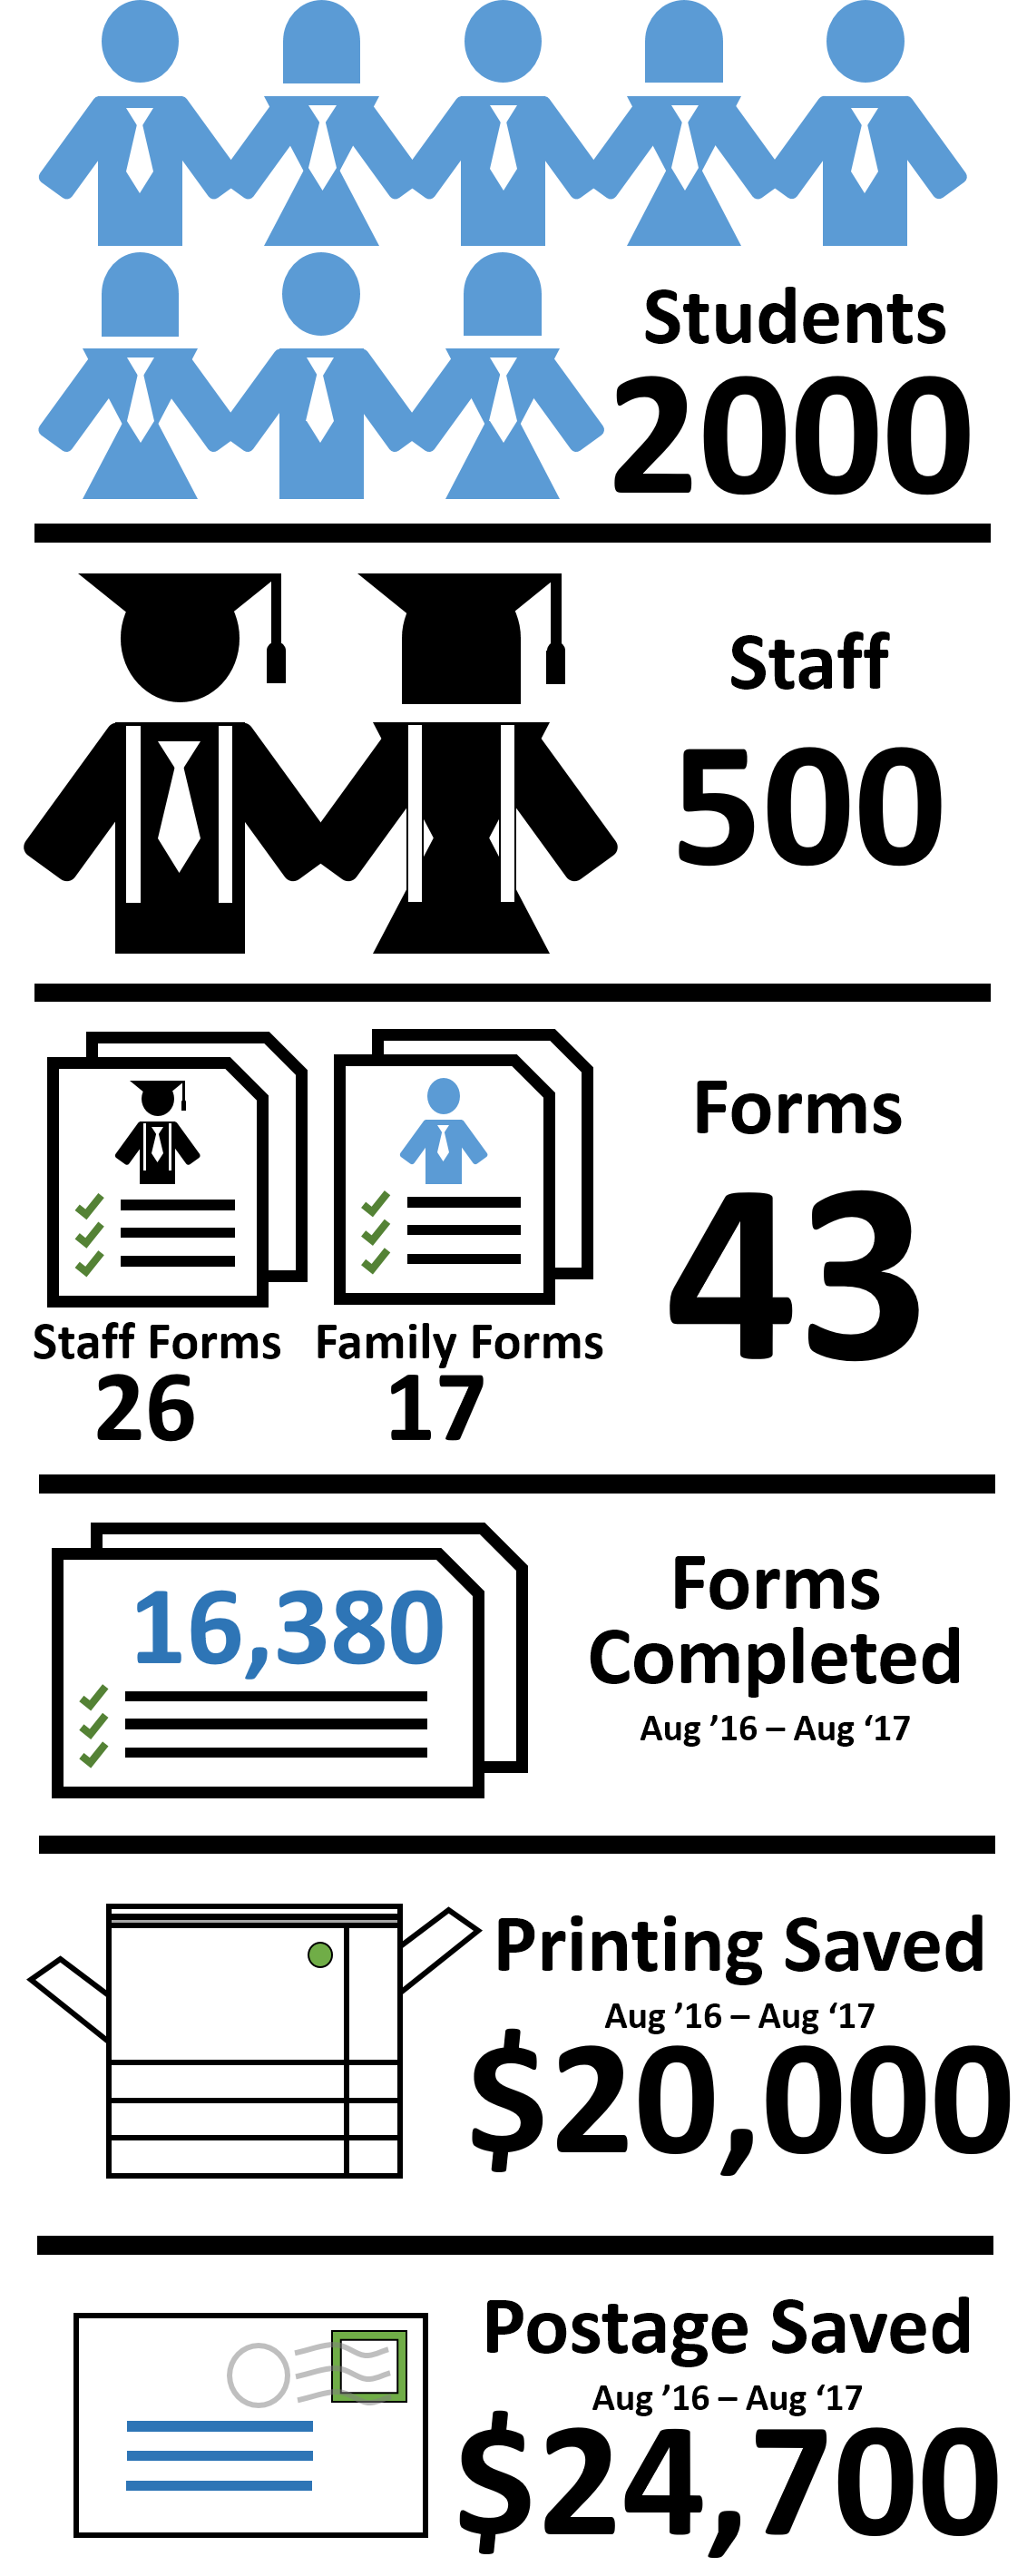
The Figures
Advantages of an Electronic Forms System
There are a number of advantages to using an electronic forms system.
Less frequent information requests
Forms feed directly into the Student Information System (SIS), in our case a system called Synergetic, but again that’s not critical. Once stored securely in the SIS, information can be accessed on demand or used to create reports, so information only needs to be provided by families once or when updates are needed. As the forms system knows the user, there is no need to duplicate what they have provided before. When an excursion is undertaken the information is already available, so there are no paper forms to be passed back-and-forth at the bottom of student’s school bags.
Reduced manual handling
Because form data is added directly into the SIS, no paper handling is involved. Time saved receiving and handling forms could be estimated to be equivalent to a full time employee; that time is offset by the time taken to developing the form in the first place. However, time spent filling forms and submitting is greatly reduced for both staff and families.
Reduced printing and postage costs
If time is money, reduced handling and filling times are saving money, but these are hard to convert into objective figures. It is possible to estimate a few more tangible items, such as printing and postage. In the last 12 months, based on forms completed, relative to past printing and postage practices, we can estimate significant cost savings as shown above.
Facilitating processes
It is possible to use electronic forms as part of a process, passing through a number of people before being finalised. This is has proven to be very useful and simplifies process handling, particularly for staff. We are now discovering processes where there was previously no paper form, or a paper form followed by manual processing, and establishing new processes using electronic forms.
Of course, a forms system does not come instantly. We have spent more than two years improving the way we create forms. Several forms have been created over a number of weeks and never used, so there is now an emphasis on involving stakeholders, defining needs and testing. A number of database-integration hurdles have been overcome to get to the point we are now.
Uses for Forms
The forms are used to collect a range of different kinds of information.
Student data and choices
Student enrolment
Absence reporting
Policy agreement for staff and students
Staff data
HR data collection including applications
Event registration
As well as data collection, the forms system has become another interface to other systems, such as the SIS. Where the SIS has a cumbersome and complicated user interface we can provide an alternative interface that is streamlined for our own context. Coupling this with the ability to drive processes, the forms system is becoming more than just a data collection system. In terms of the SAMR model, we are going beyond substitution (paper for Web) and higher levels of transformation.
In conclusion, the forms system is proving itself to be beneficial for the wider School community and we are discovering new uses for the system over time.
I recently posted about my experience organising recruiting for IT positions. I though I would follow this up with advice for those on the other end of the interview panel, based on my experience as someone involved in and responsible for hiring staff at a number of organisations. Much of this advice is relevant to any job applicant, but some is specific to IT positions.
CV and Covering Letter
If you are applying for a position, avoid applying for numerous positions with the same CV. This is something that is obvious when panel members read applications. Look for the positions that you are seriously interested in, research the organisation and take the time to customise your CV for the position.
If you are applying for a position above an entry level position, a covering letter that addresses the selection criteria is expected. You should be able to show that you are capable of covering each criterion.
As an IT professional, when writing your CV and covering letter, you should be able to demonstrate capable word-processing skills. Many people think they know how to use a word processor, but if your skills are not more advanced than when using a typewriter, you’re going to meet sticklers like myself who will judge you on your document writing skills. Think about document writing as you would when writing source code. Your document should be structured with headings that use heading styles. Formatting should avoid unnecessary white-space and include proper formatting mechanisms, such as tabs and tables. Unless it is required, submit a PDF, not the word processed document.
Length
For most positions, two pages should be your CV length limit. Exceptions are positions in higher education where research background may be expected. Keep your text brief and use points. An easy-to-skim CV will quickly get you to the next round.
Logos
Consider adding company logos in your experience list. It quickly shows where you’ve been and is eye catching.
Diagrams
A quick way to show something relative is with quick diagram, such as years of experience in past positions as a graph or timeline. Some of the most intriguing CVs I’ve seen include such simple diagrams.
Personal Photo
Should you add a photo of yourself? Some people are against this. In some parts of the world it is expected. I think that if you have a vibrant, friendly smile, I would add a good photo of yourself next to your name. If you are a female applying for an IT position, I would definitely recommend this.
Spelling and Grammar If you think spelling and grammar isn’t important for an IT position, think again. Day-to-day communication in IT is written, such as documentation, reports and even bug tickets. If you’re not a native speaker of the language you’re applying in, find a friend who is and ask them to check your writing.
Before the Interview
So you got the call and you’re heading for the interview. Don’t waste your time waiting anxiously; get prepared.
Research
Do more research about the organisation. See if you can determine what technologies the organisation is using that may be relevant to the position. Look for information about history, corporate structure and current newsworthy events. If you are given the names of the interview panel members, look for information about them and their roles; this may help you answer interview questions from them in the most appropriate way.
Write questions
At the end of an interview, you’re often given the opportunity to ‘reverse the tables’ and ask questions yourself. This is a chance to demonstrate the research you’ve done and leave a good impression. Being ready to ask questions shows you have envisioned yourself in the position and are enthusiastic about working in it. Have a few more questions that you will ask so you can pull them out selectively. It’s OK to ask about salary expectations for the position if that hasn’t been covered.
Anticipate answers
Many interviewers will ask similar sorts of questions. See my guide for some examples. Think about occasions where things have worked in past positions and where they have failed. Think about relationships you’ve had with fellow workers, where that was successful, where you had conflict and how you dealt with that. Write some of these cases down. Be prepared to be honest; answering dumbly that you “can’t think of an occasion where something has gone wrong” can be viewed as dishonesty.
Schedule yourself When presented with a set of items to remember, people tend to remember the first and the last items better. When marking assignments, markers will often fall into patterns over time, biasing submissions they see early or late in the process. Interview panels will be more open to the first interviewee, critical of following candidates as they hope for someone ‘just right’, but the last applicant has the best chance to swoop in and prove that the whole depressing series of interviews was worth it after all. If you have any opportunity to nominate your time-slot, see if you can get in last or, if not, then first.
The Interview
You’ve made it in the door. You looked good enough on paper, but now you have to prove you’re ready for the job. As well as probing you about your skills and experience, much of an interview is about picturing how well you will work with the people within the organisation. An interview can draw you from the bottom of the list to the top, but a single answer can drop you out of contention.
Consider your attire As much as we may be casual about attire in IT on a daily basis, avoiding fashion trends and false pretences, what you wear to an interview should be a step-up from the norm. In some cases, that may mean full business suit for ladies and men. See what people are wearing there and go a notch higher. If you’re not sure, it’s OK to ask what to wear to an interview.
Don’t show up early You may be eager and definitely want to give yourself buffers so as not to be late, but showing up early is a bit annoying for interview panels who are trying to keep to a schedule. Showing up early sets in motion a series of actions that eventually interrupts someone who may subconsciously judge you. Be there on time or a couple of minutes early; if that means lurking in the carpark until your time, do that.
Be ingratiating Your opportunity to warm up and share what a great person you are comes at the beginning. Don’t skip straight to the skills and experience, however keen you are to demonstrate these. Imagine the interview panel are your best friends; even if they appear weary after a series of interviews, you need to be smiling and respectful of the panel and their process.
Be specific
When answering questions, be as specific as you can. Listen to the questions as they are asked and, even if you have to take a few seconds before answer, consider how you will answer. Giving general answers may cover the question, but it won’t make you a standout applicant. If you can use specific examples from your experience, this is a plus: you’ve been there and done that. Avoid waffling; a concise answer is good. Look at the expression of the person asking the question to see if they are satisfied with your answer to the question, otherwise ask for clarification. Consider the role of the person asking and what perspective (technical, managerial, end-user) they are asking the question from. Be confident about technical skill questions; if asked about something you haven’t worked with previously, answer honestly but show an interest in learning new skills.
Be wary of scenarios Almost all interviews will include a scenario; expect some verbal role-play, written response, coding task or a combination of these. Your answer to a scenario is not as important as how you answer it. The scenario may test how you might interact with clients. When faced with a conundrum, it’s more likely that you’re being tested on whether you can come up with a workaround, rather than following corporate rules or passing decision-making responsibility upwards.
Afterwards
If you’re waiting for a long period after an interview without hearing any news, it’s probably not a good thing. It doesn’t hurt to call up and ask how the process is going. Put your efforts into other positions after a week or so, if you haven’t already.
If you were unsuccessful, do ask for feedback. As well as helping you with future applications, it shows you’re a mature person and keeps you in mind should the chosen application not work out.
A while ago I wrote a blog about learning analytics from different perspectives giving examples of different analytics based tools that could benefit different users. Since then I’ve had discussions with numerous people, many of whom have great ideas for analytics tools, but I’ve discovered there is a disconnect between the analytics people want and their understanding of where to find the data.
To get from question to answer there needs to be an understanding of where the data are located and how they can be brought together. My intention with this blog is to show you where to find data for analytics in Moodle.
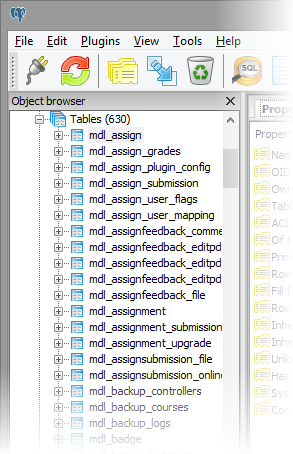
Source 1: Database tables
The database tables are used by Moodle and its plugins for data storage. They are able to be queried for information about users, and their involvement, as well as course and site information. I would estimate that more than half of the data needed for analytics are stored in these database tables.
The limitation of these data is that they are not historical – they represent the current state of the system. There is some historical data, for example Forum posts and Chat sessions, but for historical information generally you need logs or observers. One advantage of drawing from database tables rather than logs is that such data can be gathered in real-time, all the time, which is not advisable for log data (more on that later).
Here is a summary of the data in Moodle database tables. I’ve categorised the data by the perspectives relevant to analytics.
User information
name and profile fields
site access (last login)
course access (last access)
Activity involvement
Assignment submissions
Blog entries
Chat involvement
Database activity entries
Feedback responses
Forum posts
Glossary entries
Lesson activity progress and answers
Quiz answers
Scorm progress and answers
Survey answers
Wiki writing contributions
Workshop submissions and reviews
involvement in add-on activities
Grades and achievements
course grades
badges
outcomes
activity and course completion
Course information
organisation within course and sections
number and mix of activities and resources
Question bank questions and types
configuration and content of activities and resources
course enrolments (roles)
groups and groupings
Site information
organisation of courses and categories
file information
messages
“My home” page customisation
Examples of using database data
Here are some examples of how data in Moodle’s database tables could be used for learning analytics. It’s not a comprehensive list, but perhaps there are ideas here that could inspire some great analytics tools.
Student involvement and achievement
Accesses to enrolled courses
Progress through course
Relative success or risk of failure
Opportunities for students to undertake activities or interact
Teacher involvement
Regularity of access to courses
Timely interaction with students
Timely grading
Success of students in teacher’s courses
Potential to assist students at risk or commend success
Course quality
Richness of content and activities
Use of assessment
Student-teacher ratios
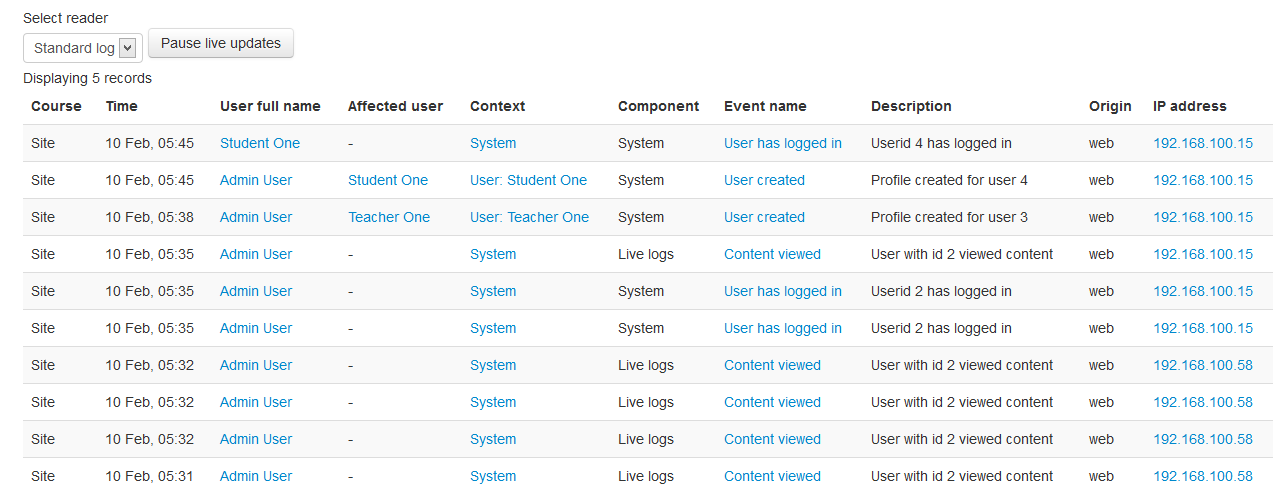
Source 2: Logs, Events and Observers
Currently the logging of events in Moodle is undergoing change. Rather than referring to past implementations of logging, I’ll be more forward looking, referring to events and logging as used to some extent in Moodle 2.6 and used fully in Moodle 2.7. The new logs are richer and more focussed on educational activities.
From logs it is possible to extract information about events that have taken place. Here are some relevant aspects of events that are captured.
Component
The part of Moodle (module, block, core) in which the event took place
One of the problems with logs is that they grow very large. This makes efficient searching and processing of log information almost impossible, particularly on larger sites. With richer event information being captured, there are also events being recorded from more places in Moodle. There is the potential to direct log information to log stores outside of the Moodle database. The intention of this change is to allow searching and processing of logs without impacting the performance of the Moodle server itself. There is also the potential to export log data to files for filtering and analysis outside Moodle. So it is possible to get detailed log information, but this cannot be used in real-time, say for a block or a report that combines logs with other information.
One way to capture event information so that it can be used in real-time is with observers. As each action takes place an event is “triggered” within Moodle and observers can “observe” events based on certain criteria. The new logging system is an event observer that consumes all events that are triggered and stores them (to one or more log storage plugins). It’s possible to create new observers that can focus on a subset of events, store relevant information so that it can later be presented efficiently. If you were interested in, say, creating a report that focussed on enrolment actions, you could allow the report to observe enrolment events, store records in its own table and then present the results to users appropriately, any time it was needed. The report could even make use of messages to send out alerts when necessary.
Examples using events and log data
Monitoring site activity and focal points
Number of user accesses, which could be used to infer time online
Repeated exposure to resources and activities within courses
Students accessing teacher feedback on activities
Student retention in courses (based on enrolments and unenrolments)
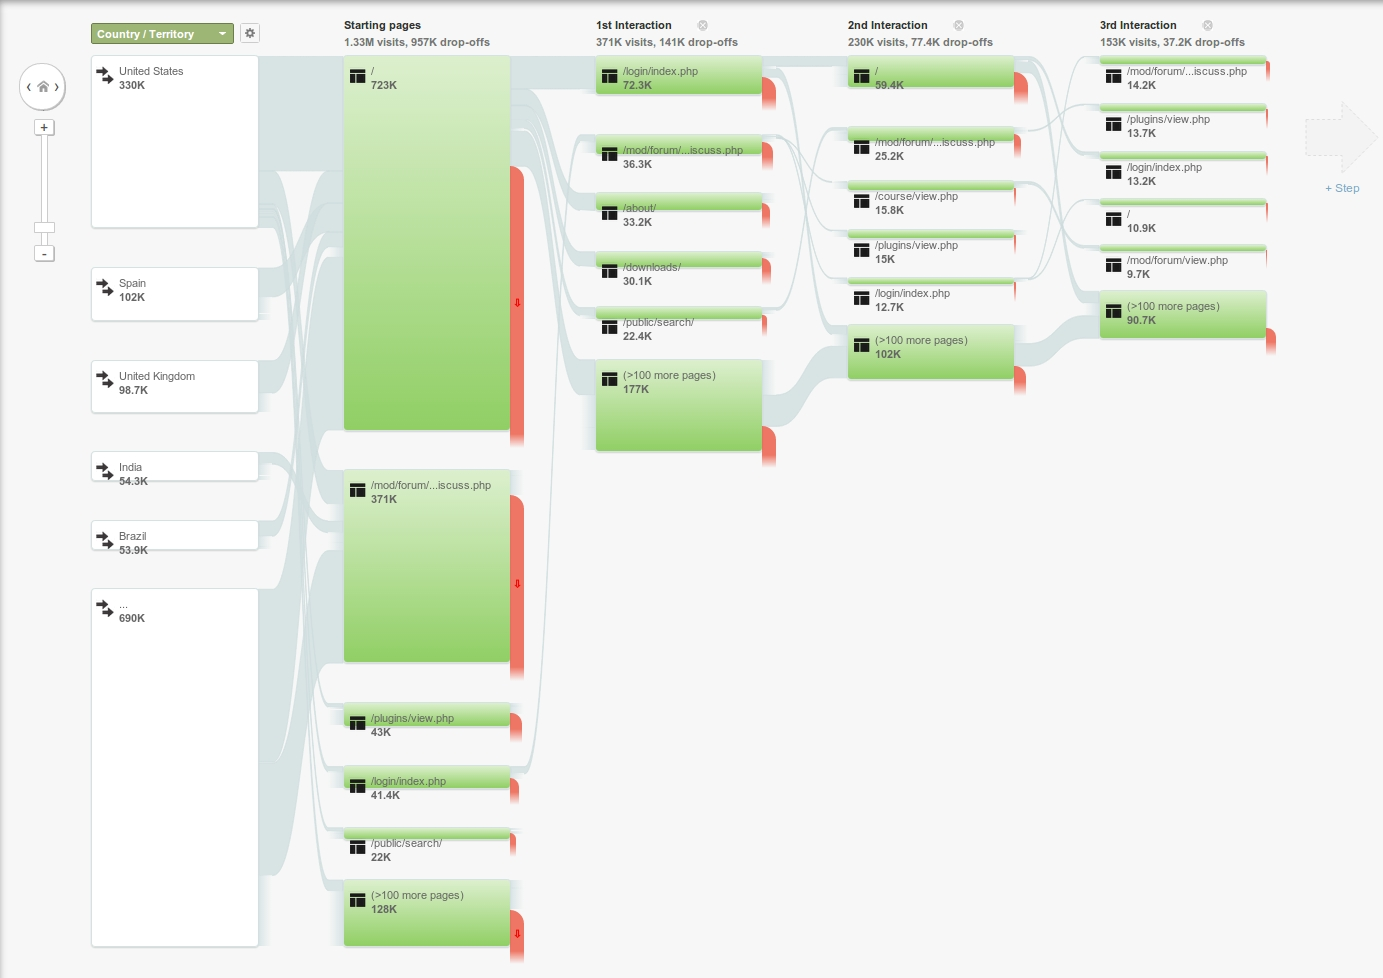
Source 3: Click tracking by external monitors
Google Analytics for moodle.org
The term “analytics” has been popularised by Google who offer a service that allows you to track users as they move through the pages of your website and then report information about the users back to you. It is possible to use Google Analytics with a Moodle site. After registering your site you need to slip some JavaScript into the pages of your site (Site administration > Appearance > Additional HTML or in your theme’s footer.html file). Google will then collect and present information about your users including…
their environment (browser, OS, device),
where in the world they are coming from and
the paths they are following through your site.
This information is useful to administrators wanting to ensure their Moodle site is catering to users’ needs. To discover learning analytics from Google Analytics, it is possible to drill down into usage information, This will not yield the same sort of information as the Moodle database or logs, instead showing patterns of behaviour. This information could potentially be fed back into Moodle as Google provides an API to query analytics data, which could be presented in a Moodle report or block.
Another relevant click-tracking tool is the Moodle Activity Viewer or MAV. This is a system in two parts: a server-side component that collects course activity usage statistics and a browser plugin that takes the page delivered from Moodle to your browser and overlays the page with colour to turn the course page into a heatmap. This shows teachers where the focus of activity in a course is taking place.
Could this understanding be built-in?
Unfortunately, at this stage, there are no simple generic mechanisms built into Moodle that allow you to freely gather and combine information without writing code. There are some exceptions attempting to allow generic report writing, but I don’t think these are simple enough for ordinary users yet. Currently, if you have specific questions that can’t be answered using standard Moodle reports, the best way to get the answers you want is by writing (or get a developer to write) a plugin (report or block). Hopefully this guide so far will provide an understanding of what data are available and where to find them.
Is there a possibility to create the reports without coding them from scratch?
One potential future step would be to allow plugins (and Moodle itself) to be able to describe the data they store. With this meta information, it could be possible to use a generic tool to gather and combine specified information on-the-fly and tweak the criteria as needed. This would allow access to the rich data in the Moodle database (with appropriate security constraints, of course).
It could also be possible to create a generic observer that can be configured on-the-fly to consume events of interest and record them. The current logging and events system APIs allow such alternative logging. Providing a sense of what events could be observed would be the challenge here, but at least events are now somewhat “self describing” meaning meta information is recorded with the coded description of the event objects.
For administrators interested in the sort of user information that Google Analytics reveals, it is possible in Moodle to determine a user’s browser, OS and device type. Moodle already does this to allow page customisation for different combinations of these factors. It would not be a great step to capture and present this information in a report. Google could probably do this better, but perhaps you’re not too keen to allow Google to snoop on your students and their learning activities. Moodle logs could be used to infer the paths and behaviour of students, but this would be a very costly exercise, requiring a great deal of computing power, preferably away from the Moodle server.
What to do with this data?
The final challenge then is to go beyond data gathering and analysis to provide tools that can use this information to support teaching; tools that help students learn, teachers teach and administrators to cover their butts. Only then will we see the LMS take education beyond what could be achieved in the classroom.
The submission deadline for the Moodle Research Conference (MRC2014) is approaching fast. I imagine many people around the world are feverishly preparing their submissions. Unlike most conferences, the MRC draws together people with different experience from many fields who happen to be conducting research in and around Moodle. Being one of the co-chairs for this year’s MRC, I thought I’d put together a guide to help authors.
Links to past research
As a researcher, you are never working alone. Basing your research on work that has come before gives you a solid foundation and increases the credibility of your work. Reviewers are not only judging your paper, they are looking at your knowledge of the field. Citing appropriate past research demonstrates your understanding and places your work within your research area. References should be formatted according to the prescribed standard and should provide enough detail to allow a reviewer to find the cited work. Cited works should be primarily from peer-reviewed sources. Ideally, you should be able to demonstrate a need for your current work based on past research.
Research questions
After setting the paper within past research, you should then define the aim of your research and this is done with research questions. Such questions could be phrased as hypotheses, but this is not essential for an MRC paper. Your research questions can be used to define the structure of the remaining paper including the conclusions at the end of the paper, where the answers to these questions should be presented.
Evidence
Without evidence a paper is simply opinion. In order to answer your research questions, you need to gather and analyse evidence. The evidence should answer the research questions, proving or disproving something – either outcome is valuable to report. The evidence you present could come from one (or more) of many sources such as experimental results, user data gathered in Moodle, surveys, case studies, etc. You should be able to show how the evidence you have gathered builds on the past research you have written about earlier in the paper. Even if your paper is focussed on the the development of a new tool (such as a Moodle add-on), you should go beyond a simple description, showing evidence that the tool works in practice and can have benefits.
A few more tips
Writing quality and flow
MRC papers must be written in English. Poor writing distracts reviewers from the important research work you are reporting. If English is not your first language (or even if it is) get someone else to proof read your paper before you submit it. Also consider the flow of your paper: each paragraph should follow on from the last and each section should lead into the next. You are arguing the value of your work and your argument should seem logical.
Follow the template and use its styles
The MRC, like most conferences, provides a template to demonstrate the expected paper format. Rather than copying the styles shown, use the template as the starting point for your submitted paper. Use the styles in the template rather than manipulating text to look like the styles. Doing this is easier and is something all word processor users should be able to do. It also ensures all papers in the final proceedings are consistent. If your paper appears different, reviewers will feel responsible to point this out and that will detract from the review. Look through the Moodle Research Library for examples of accepted papers from past MRC conferences.
Anonymise your work properly
The MRC uses double-blind peer review, so authors don’t know who is reviewing their work and reviewers don’t know who has authored the paper they are reviewing. If the reviewer sees you’ve done a poor job anonymising your paper, that may impact their review. See the guide to submitting papers for things to check when anonymising your document.
Present data visually
A picture is worth a thousand words. Presenting data as a table or chart makes it easier for readers to understand. Screen captures are a great way to show tools in use. All tables and figures should be labelled and there should be a reference to these items within the text to include them at appropriate points in the flow of the document.
Simon, Carbone, A., de Raadt, M., Lister, R., Hamilton, M., & Sheard, J. (2008): Classifying Computing Education Papers: Process and Results. Proceedings of the International Computing Education Research Conference (ICER2008), Sydney, Australia, 6-7 September, 2008. 161 – 171.
Simon, Sheard, J., Carbone, A., de Raadt, M., Hamilton, M., Lister, R., et al. (2008): Eight years of computing education papers at NACCQ. Proceedings of the 21st Annual Conference of the National Advisory Committee on Computing Qualifications (NACCQ 2008), Auckland, New Zealand, 4-7 July 2008. 101 – 107.
I was asked by a teacher of software development if I could give an overview of how we use the Scrum Framework in a real-world, open source project, here at Moodle. Being a former development teacher myself, I could not refuse.
The video below outlines the Agile software development processes followed at Moodle HQ. If you’re a developer or someone training to be a developer, this will be relevant to you.
How do you encourage developers to be more productive?
A few months ago, I was intrigued by a presentation by Dan Pink, an American public speaker. Here is a version of that presentation (and there are a few similar presentations around, including a TED talk).
In the presentation, Pink claims that extrinsic motivators, specifically financial incentives (bonuses, raises, promotions, stocks,…), can be counter-productive to the goal of encouraging workers in certain circumstances. In the presentation, Pink refers to studies at MIT, so I went searching for publications for these studies and found Ariely (2005) and Awasthi & Pratt (1990).
While people can be motivated by financial incentives, the studies found that financial incentives can reduce performance for tasks involving a cognitive component. Software development certainly involves cognitive tasks, in fact programming is about as cerebral as you can get.
So if money doesn’t work, what does? Pink’s thesis is that employees will be more productive when they have a sense of:
autonomy,
mastery and
purpose.
Pink refers to cases at Atlassian and Google, where employees are reported (in the media) to receive many perks. I’ve been to Google, and while I did enjoy the free food, the work environment was certainly not anarchistic, in fact it seemed quite ordinary on the inside. What Pink emphasises is that these companies offer a degree of autonomy to their workers, that employees have the potential to develop professional masteries for their current job and for future jobs, and that employees are able to see a sense of purpose in what they do day-to-day.
Developer Incentives at Moodle?
Some aspects suggested by Dan Pink were already in place at Moodle, but some have been added or enhanced in recent months. I will describe how we offer a sense of autonomy, master and purpose to members of the STABLE team at Moodle (the devs who work on the existing releases of Moodle).
Autonomy
Apart from being a relatively relaxed working environment, there are some specific differences that may set Moodle apart from other development offices.
Devs choose, set-up and maintain their own development environments. Code meets at the repository, but how it gets there is up to the developer.
Using the Scrum framework, devs choose issues they will resolve from a prioritised backlog of issues. This ensures that the highest priority work gets done, but devs have a sense of ownership over, and responsibility for, the issues they choose.
After every two sprints (sprints are typically three weeks long), devs have a week to work on a project of their own choosing. The projects have to benefit the Moodle community, but is open to interpretation by the developer. This means that one week out of every seven, the developer is completely autonomous.
Mastery
Mastery is an area we could be working more on, but there are a few initiatives in place at Moodle.
Devs can nominate external training courses and are supported to attend.
Devs nominate areas of interest in Moodle and are allowed to specialise in those areas.
Devs receive in-house productivity training . There are also irregular presentations on development related topics related to the current focus of work (for example, in-code documentation writing, Web services, etc.)
Purpose
Purpose is something that Moodle has a lot of. Moodle allows many people to access education, some of whom would not be able to do so otherwise.
In saying that, it is easy to lose sight of that purpose when devs are focussed on lines of code while reading the grumbles of users on bug reports.
It is important t0 regularly remind developers that there is a community out there and they really appreciate the work devs are doing. We have, in the past, dragged devs to a Moodle Moot, where there is a lot of back-patting. We are hoping to do that again this year.
If you are a member of the community and wish to express your gratitude, please do so. Send me an email or post a message on the Moodle forums. It will really help.
Do these incentives work?
From my perspective, I would have to say “yes” – encouraging a sense of autonomy, mastery and purpose does help developers, their progress, as well as the general working environment. It’s hard to quantify the effect of making these aspects more obvious to developers, but I have noted some improvements since we have.
Our turn-over of staff is low. The devs seem are content and passionate about their work, particularly when they have a chance to work on what they are interested in. This really helps avoid slacking off when it comes to doing “more of the same”; with sufficient variety, developers are quite happy to switch to unstructured work and then back to structured sprints again.
General productivity is higher and being maintained. The number of issues being led through our process has increased and that is a good sign.
The STABLE team is producing some significant contributions to Moodle, and not always in the same way. We had a very colourful show-and-tell session last Friday with some very excited developers (including devs from outside the STABLE team). Here are some examples of what was put on show…
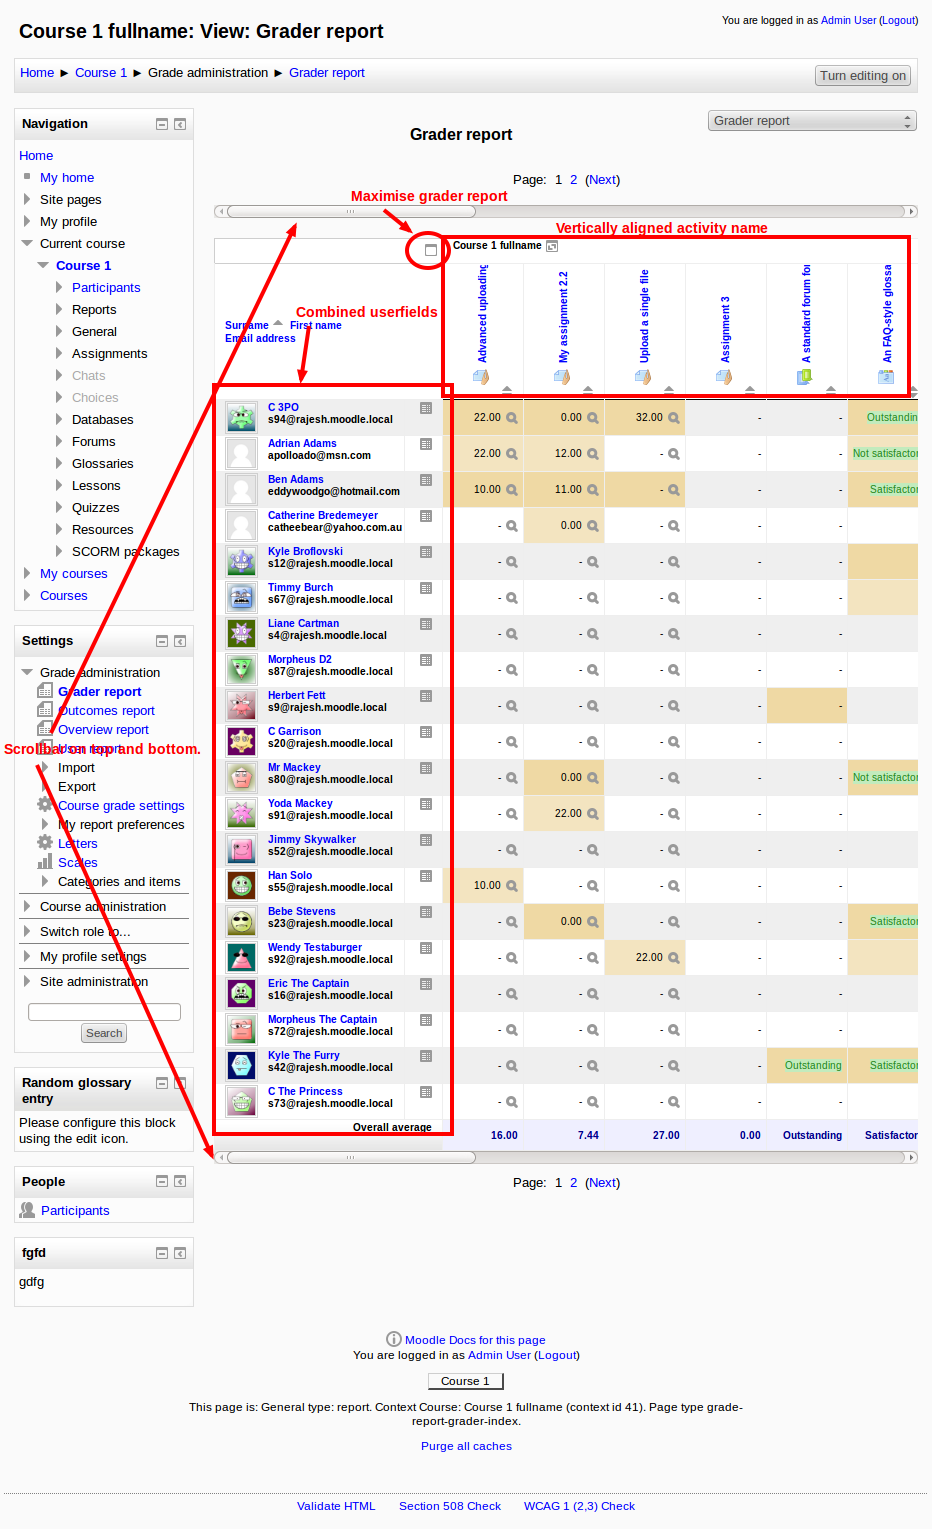
An optimised view for the Gradebook (Rajesh Taneja)
There are a number of issues relating to the usability of the Moodle Gradebook, which can become unwieldy. With some simple modifications, the Gradebook becomes a much more usable space.
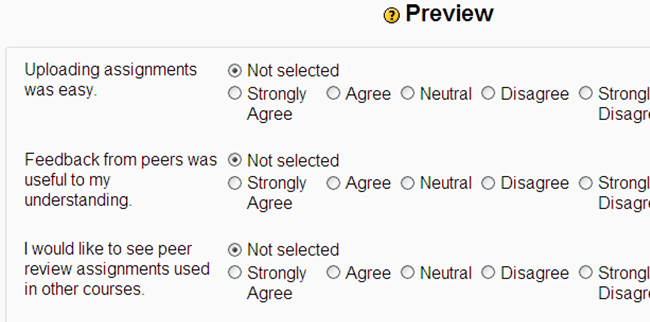
Previews for Database activity uploads (Adrian Greeve)
Currently, uploading data into a Database Activity provides little feedback or control. Adding in a preview, with field matching, allows easier uploading.
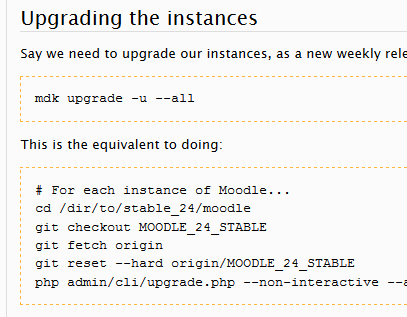
The MDK automates many regular dev tasks including Git operations, adding information to issues on the Moodle Tracker and automation of site instantiation and population with dummy data.
This project has been quite a collaborative effort and is still growing.
Technical debt is accumulated future work that has amassed as the result of decisions made during the development of software (or more generally during the development of information systems). The term was coined in 1992 by Ward Cunningham, who realised that as soon as software is created there is an element of deferred work, which can be equated to “going into debt” (Cunningham, 1992).
Analogously, technical debt is often equated to financial debt, such as a loan. The value of a technical debt is not dollars, but the cost of the time needed to rectify problems. As software is created, compromises are made between delivering a flawed but acceptable system now or delaying and delivering a superior system later. These compromises result in a backlog of work that needs to considered before a future release.
Technical debt comes about when developers create less than ideal code. Fowler (2009) suggests that developers can do this deliberately or inadvertently. A developer can deliberately decide to use a quick-and-dirty solution now with the intention of replacing this solution with a better one later. “I’m not sure if that database query will scale, but I’ll write a TODO to fix that later.” Developers can choose to sacrifice non-essential software elements by failing to write documentation, avoiding creating reusable abstractions or failing to follow coding standards. Alternately a developer can inadvertently introduce problems into the code. This can happen through forgetfulness as deadline pressure builds or simply when the skill required to solve a particular problem exceeds a developer’s technical experience. “I’m not exactly sure how this code works, but I’m going to reuse it now as it seems to solve the problem.” This approach is sometimes referred to as Cargo Cult programming (McConnell, 2004).
Fowler also suggests that technical debt can be introduced through behaviour that is either reckless (“I don’t know how significant this is but I don’t have time for it now.”) or prudent (“The cost of introducing this now will be greater than the cost we will incur by delaying our release.”).
By crossing these deliberate-inadvertent and reckless-prudent dimensions as axes, four quadrants appear; these quadrants can be used to categorise the sources of technical debt.
Fowler’s technical debt quadrants
As no system is perfect, technical debt is something that cannot be avoided. It is something that needs to be managed rather than ignored.
Is technical debt bad?
Technical debt, like financial debt, is not all bad. Any debt is doomed if there are no means to repay it. “Few of us can afford to pay cash for a house and going into debt to buy one is not financially irresponsible, provided that we know how to pay it back” (Allman, 2012). Projects need to consider the level technical debt they are capable of supporting and be aware of their technical debt at all times, ensuring that it does not exceed this level.
If a software project accumulates more technical debt than can be “repaid”, the quality of the software becomes poorer. If lacking quality reaches a level that is obvious to users, this can affect their decision to use that software in future.
What is “open technical debt”?
Open technical debt is the technical debt accumulated by an open source project. To understand it you have to know that open source projects differ from commercial developments in terms of code ownership, project management and in the philosophy that motivates the project.
Open source software is freely given to a community of users and that community is invited to provide feedback to the project to guide its future. Compared to a software system created by a commercial vendor, where the code ownership is simple, in open source projects the community owns the software and benefits from the effort they invest.
Open source projects vary in scale from small projects, involving a small number of loosely organised volunteer developers, through to large-scale projects, that are bigger than many commercial software undertakings. The project I am involved in is Moodle, which involves hundreds of developers and has many thousands of registered sites with over 60 million users worldwide. The project employs 25 full-time employees and works with a large network of commercial Partner organisations who deliver services to the community and help support the project financially. Managing such a project is often difficult as there is no single product owner who you call on to make decisions and set priorities.
When technical debt accumulates in an open source project and impacts on the quality of the software, it is obvious to the community. But this is balanced by the community’s sense of responsibility to fix these problems, improve the quality of the software and pay off that technical debt.
In open source projects, strengths can also be weaknesses. The potential of a large community and large number of developers can lead to powerful software, but left unchecked it can also lead to technical debt. If that debt is not recorded and “paid off” it could lead to the downfall of the project.
Where does open technical debt come from?
It is important to be aware of where technical debt is coming from in a project. Using Fowler’s technical debt quadrants it is possible to categorise the sources of problems in open source code.
You might think that most technical debt in an open source project is the result of reckless developers contributing code with inadvertent consequences to the project as a whole. In fact this is quite the opposite of the behaviour that an open source project elicits from developers. When someone contributes code, their code becomes part of the open source and is open to scrutiny by all. Metaphorically, their dirty washing is being aired for the entire world to see. If a problem is later found it is easy to track it back to a change made by a specific developer. This tends to lead to well-conceived code with a sense that reputations are on the line.
As the person responsible for triaging issues as they are reported for the Moodle project I know every freckle and bump in its complexion. On a regular basis I track the sorts of issues that are left in our bug tracker and a large chunk of these are unfulfilled improvement requests. When releases are finalised, decisions are made to “draw a line”, even though improvements could be made. So the technical debt of the Moodle project, as an example of an open source project, is predominantly in the prudent-deliberate quadrant with lots of ideas for making the software better being known but not acted upon.
Technical debt quadrants in open source
Does this differ from a commercial project? Well I can’t say for sure, but I suspect it does. I would say that closed source software lacks the pressure that openness creates. Also, when the priority setting falls to a single decision maker with commercial deadlines to meet, I think that technical debt would shift more to the reckless side of this field. But then, I’m biased.
Avoiding and embracing open technical debt
While accepting that some technical debt is unavoidable, there are ways that it can be minimised.
Openness of flaws
Having an open bug tracking system allows anyone to see what bugs have been reported and what improvements have been suggested. This means that the extent of the technical debt of a project is on display to all. Being open in this way creates incentives for developers to avoid creating technical debt in the first place, and to reduce technical debt in the long-term. It also shows the community that work is being done in a way that follows defined priorities.
Agility
Following agile software development practices allows developers of an open source project work together to fulfil the priorities of the project. As priorities shift (and they do when you are responding to a community), being agile means that developers can respond quickly. In fact I can’t conceive of an open source project being managed any other way.
Review
Contributed code in an open source project is not automatically accepted. Before it is integrated with the codebase it usually has to satisfy experienced developers involved in the project. This is certainly the case at Moodle where all code goes through at least three levels of review before it is integrated into rolling releases and even more before major releases. When this is done politely, as well as ensuring software quality, this also helps to assure contributing developers and instil a sense of confidence.
Modularity
Once any software project grows to more than a trivial size, it needs to be modularised. In open source this is especially beneficial for two reasons.
Modularity provides focus points for developers who want to contribute to a project without needing to understand the entire codebase.
Modularity allows a project to designate code as official and unofficial. Official code is what is distributed to users as the core project code. Unofficial code can be plugins that individuals have written. Technical debt can then be measured against the official core code while keeping the potential “high-risk” debt of unofficial code “at arm’s length”. That’s not to say that developers sharing plugins should not be supported and recognised.
Willingness to deprecate
As a project develops, changes will occur over time. Often modules become neglected, particularly if no one from the developer community has an interest in maintaining that module. When this happens, the community has to recognise the state of the module and deprecate it. Deprecation is like writing off technical debt; while it comes with a loss of functionality it also notionally frees up resources to focus on other parts of the project.
References
Allman, E. (2012). Managing Technical Debt. Communications of the ACM, 5(5), 50 – 55.
At the recent Australian Moot, a hot, emerging topic was “analytics”. Analytics have the potential to help students, teachers and institutions make better choices that lead to improved learning outcomes. Analytics were not possible in traditional education – they are, however, something a learning management system (LMS) can easily provide, if we can just figure out what they are…
What are analytics?
Analytics is a relatively new term; so new, in fact, that my spell-checker doesn’t recognise the word. It’s a real word, though; it must be as there is a Wikipedia entry. The term has been popularised in the online world by Google who offer analytics about your website so you can see details about your site visitors.
But what does the term analytics mean for education in the context of an LMS? At a panel session during the aforementioned moot, the topic was raised and this was the first question asked – what are analytics? One of the panel members, Alan Arnold from the University of Canberra bravely offered a definition: “Analytics are any piece of information that can help an LMS user do their job.”
“Analytics are any piece of information that can help an LMS user do their job.”
Thinking more deeply about the subject, I propose that LMS analytics are useful calculable quantitative gathered collections of information, based on the activities of users within or around the LMS, presented in forms that allow decisions leading to improved learning outcomes. (Quite a mouthful.) There’s lots of information about a user that can be collected in the LMS. The trick is to tease out and combine the useful bits and present them simply.
So the question is not so much “what are analytics?” but is instead “what analyics do you need?” and perhaps “how can you get them?”.
What analytics do you need?
Not all analytics are relevant to all users. If you are a teacher, you’re probably thinking about getting information that can allow you to teach better. If you’re a policy maker at an institution, you’re probably wanting to know how successful your teachers are with their students. Bet let’s not forget the students as well; there is information in the LMS that can help them also.
On the plane back from the Moot I decided it would be worth starting a catalogue of all the different analytics that could be captured in Moodle. At lunch I threw these at Martin and we cranked out a few more.
Analytics useful to Students
Progress
With an LMS, it is possible to achieve regular assessment within a course based on a rich set of finely chunked multi-modal activities, and while this can lead to deep learning, it can also be overwhelming for students. It is, therefore, useful for a student to know where they are up to in a course and what they have to do next. Students who use short-term planning tend to be more successful; they just need a quick snapshot of their progress.
Relative success
Deep learners are more successful and deep learners are characterised by meta-cognition about their learning. Providing analytics about their relative success can allow students to know whether they are on track of if they need further exposure to a topic. Relative success can also be used to introduce a competitive element into a cohort, which some educationalists recommend.
Opportunities to interact
If students are studying in isolation, it may not always be apparent when there are chances for them to interact with peers or teachers. Determining the level at which a student is interacting could be seen as an analytic that can be used to direct them to opportunities for communication and collaboration.
Analytics useful to Teachers
Student participation
In an online world, it is more difficult for a teacher to know which students are participating and those needing a push. Students can fail to participate for numerous reasons, usually valid ones. Sometimes a student may need to be encouraged to withdraw from a course and re-enrol later. Where analytics can help is in the determination of the timing of when such decisions need to be made. That’s not to say that such information needs to be complex; it could be as simple as “traffic light” coloured icons next to a list of names of students, ordered by risk.
Student success
Assuming a student is involved, a teacher also wants to know how successful they are. This could be the product of assessment and views of resources. If students are progressing through the course with unsuccessful results, then they may need to be encouraged to re-expose themselves to a topic within the course before progressing further.
Student exposures
Moving away from a course modality where “one size fits all”, it is useful to know how many times a student was exposed to a topic before they were successful. This is a differentiating factor among students in a cohort. If students are progressing with few exposures, perhaps they are finding the course too easy, perhaps even boring, and may need to be challenged further. If students are requiring numerous exposures before they are successful, then perhaps alternate presentations of a topic need to be created to suit the learning preference of particular learners. Such an analytical tool can assist a teacher to deliver learning at an individual level.
Student difficulty in understanding
Through an analysis of exposures and assessment results, it may be possible to determine which topics, or areas within a topic, students are finding difficult. This may indicate areas that need to be revisited in the current delivery or enhanced in a future delivery of the course.
Student difficulty in technical tasks
When students are undertaking learning, the last thing they want is to be stifled by an inability to express their understanding because of by the way a course is set up within the LMS. Students patterns of use within the LMS may indicate they are having such difficulties, and a teacher can be alerted to take action.
Feedback attention
Teachers take time and spend effort creating feedback for students as a reflection of their understanding. It is useful to know which students have paid attention to such feedback, and which students may need to be encouraged to do so. Going beyond this it may be possible to deliver information to a teacher about the effectiveness of their feedback on students’ understandings as reflected in subsequent assessment.
Course quality
In several institutions that I know of, part of the measurement of a teacher’s effectiveness is judged by the quality of the courses they are producing within the LMS, based on a set of metrics. Such measurements can be used for promotions and to drive the development of PD activities. If such metrics can be automated, then analytics can be produced for teachers that encourage them to improve their course by increasing the richness of their resources, improving the quality of their activities, including more activities of different kinds, providing more opportunities for students to interact or collaborate.
Analytics useful to Institutions
Student retention
Analytics can provide more information about students than simple pass/fail rates. Analytics can help determine when students may be at risk of failing and in which courses this is more likely to happen. Such analytics can help an institution to send resources to where they are needed most and to plan resources for the future.
Teacher involvement
There may be ethical implications in monitoring teacher involvement in a course as it is akin to workplace survelance. However there is information in an LMS that can be presented in a useful way in relation to training and promotions. It might also be useful to anonymously tie in a teacher involvement analytic with other analytics to find correlations.
Teacher success
As well as looking at success in terms of pass and fail, it may also be possible to determine where teacher interventions have encouraged students to achieve beyond their expected outcomes.
Relative course quality
Clearly not all courses are equal, but how do you determine which is better. There have been a number of attempts to manually measure aspects of a course such as accessibility, organisation, goals and objectives, content, opportunities for practice and transfer, and evaluation mechanisms (Criteria for Evaluating the Quality of Online Courses, Clayton R. Wright). If such metrics can be automated, then analytics can be created with can reflect the quality of courses. Such metrics could also be fed back to teachers as an incentive to improve their courses.
What analytics would you add to this list?
How can you get them?
So, you want these analytics, but how can you get them? Some of them may already be accessible via various mechanisms, however I think we still need to work out how best to draw this information together in a simple way for specific users.
Moodle currently logs most actions that take place within the LMS. It is possible to view log reports, but they are limited to interaction in terms of activities within a course.
There are a number of existing plugins and extensions to Moodle that attempt to provide analytics to users. Among these there are a batch of report generators, many of which are quite configurable.
The Configurable reports block plugin is a configurable system that allows reports to be created and used by various roles. It may be a good model to use to start a set of standard analytics reports within an institution.
The Custom SQL queries report plugin allows an administrator to run any query against the database used by Moodle. It’s clearly flexible, but not something you can put into the hands of all users.
The Totara LMS is a rebranded, extended version of Moodle. One of the aspects built onto the standard Moodle install is a reporting facility that provides customisable reports to users of different roles.
There are also a number of blocks available and in-the-works that attempt display analytical information to users.
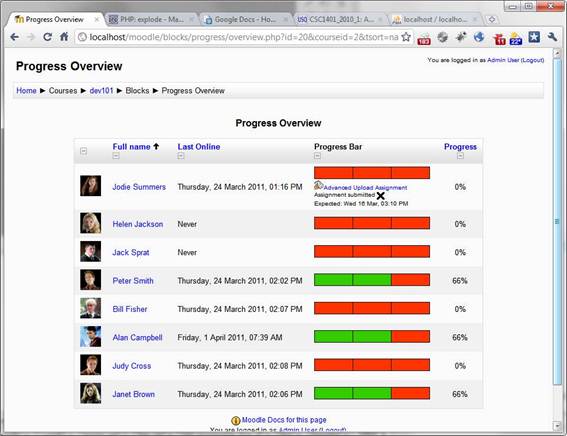
My own Progress Bar block shows a simple view of course progress to students and an overview of student progress to a teacher.
The Engagement analytics block is currently in development, but I have seen a demo of this and it looks good.now available. The block allows a teacher to specify expected targets for students then presents to teachers simple traffic-light icons next the names of students at risk.
The Graph Stats block shows overall student activity in a course over time.
Simple queries
A lot of these analytics can already be queried or calculated from the data already stored in the Moodle databse. The Report plugin type is available for presenting pages if information to users and is applicable for analytics. The Block plugin type is available for simple, compact presentation of information. Both of these APIs can present different displays to users with differing roles.
New logging
Currently, most of the logging that takes place in Moodle ends up in a single table. For simple lookups, this is not a problem, but for complex conjunctive queries, working with a large log table can hog the resources of a server. The current system of logging is likely to be a target of future work at Moodle HQ so that both the recording and retrieval of information can be achieved efficiently.
Measurement of a number of the interactions required for the analytics above is not possible using the current log and module tables. Viewing the recording of user interactions from an analytical perspective may lead to new information being captured for later analysis and presentation.
AI or user optimised queries
When you have a wealth of user interaction information available, why stop at the limits of human developers.
Genetic algorithms, neural networks and other heuristic approaches may reveal newly refined analytics or even new analytics altogether.
Crowd sourced optimisation of analytics reports may allow a collective intelligence to refine analytics so that they are even more valuable and reliable.
Are there other tools or technologies that you can think of that would help gather analytics?
Analysing analytics
Providing analytics allows us to study the impact that analytics can have on the users who view them. This allows general research questions such as “what analytics promoted better learning, teaching or retention?” Also, specific questions can be asked about individual analytics, such as “does feedback attention have an impact on learning outcomes?” Queue the savvy educationalists…
Update 3 July 2020: This post is showing its age. Most of the information contained here is now out of date. I’m leaving the post here so there is a record of information about the book I wrote all those years ago.
Last year I wrote a book titled Moodle 1.9 Top Extensions Cookbook. The timing wasn’t great as Moodle 2.0 was just about to be released. Although much of the content is relevant to 1.9 and 2.0, the publishers (Packt) insisted on being version specific. I hope to have the chance to update the book in the future.
I gave a presentation at the Australian Moodle Moot (MootAu11) and I’ve had a few requests to share that presentation since, so I thought I would flesh out my presentation into a more digestible form.
I’ll start at my number ten and work my way to number one.
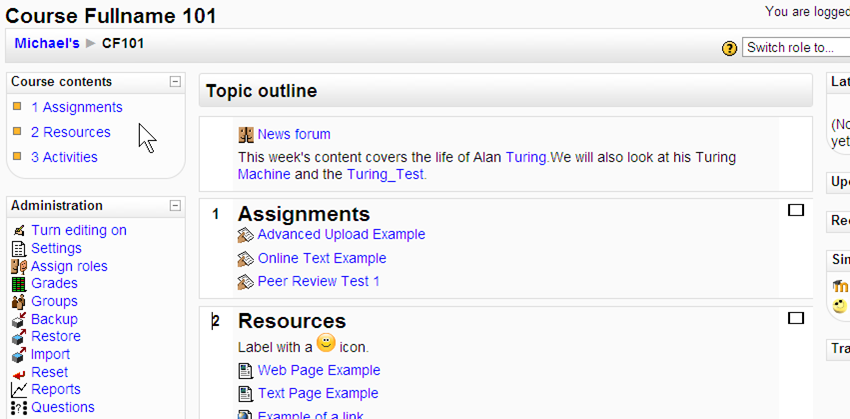
10: Course Contents block
The Course Content block creates an automatic table of contents for a Moodle course. I’ve often seen instructors doing this manually.This is a handy tool when course pages grow long.There is only a version for 1.9 available. In Moodle 2.x there is the Sections block, but it does not show section titles like the Course Contents block.
The Progress Bar block shows students their progress in a course. It’s an easy way to help students monitor their progress and to motivate them to complete set tasks in the course.In the Moodle 2.x version there is an overview page that shows teachers the progress bar of each student. This allows teachers to see which students are keeping up and which are falling behind.
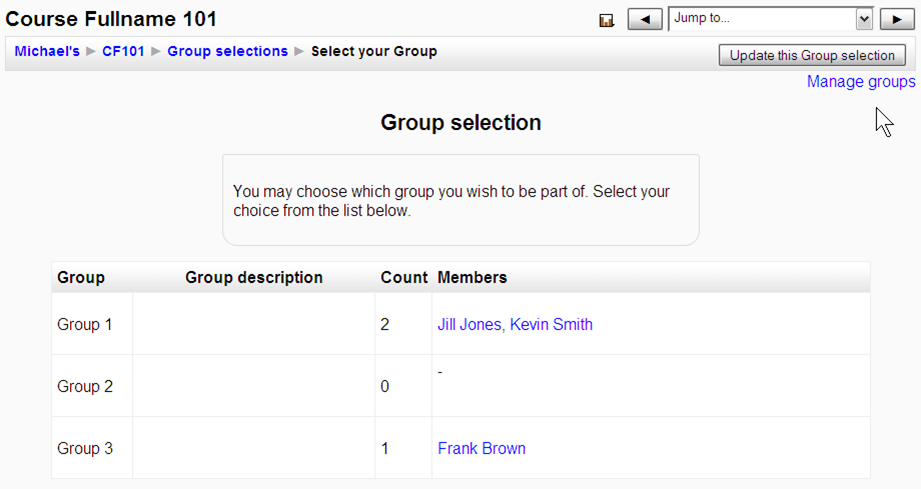
The Group Selection module allows allow students to sort themselves into groups. Once student choose their groups, the groups work as normal Moodle groups.Application ideas:
Project groups
Interest clubs
Research collaborations
This is something I have heard lots of instructors calling out for.
Author
David Mudrák, Petr Škoda, Helen Foster, Anna Vanova
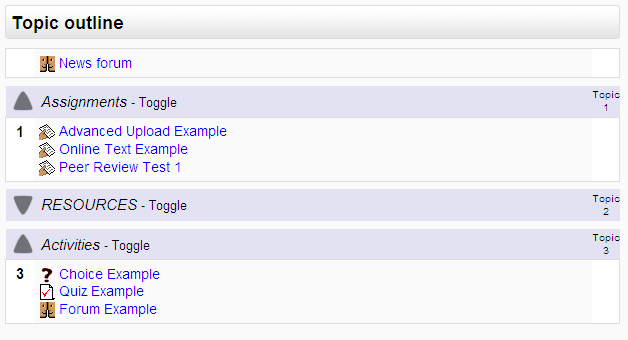
The Collapsed formats allow you to avoid the dreaded “Scroll of death”.Sections can be toggled open and close. The format sets the current week or topic open automatically and each user’s state is remembered when they return to the course page.There is a topics format and a weekly format.
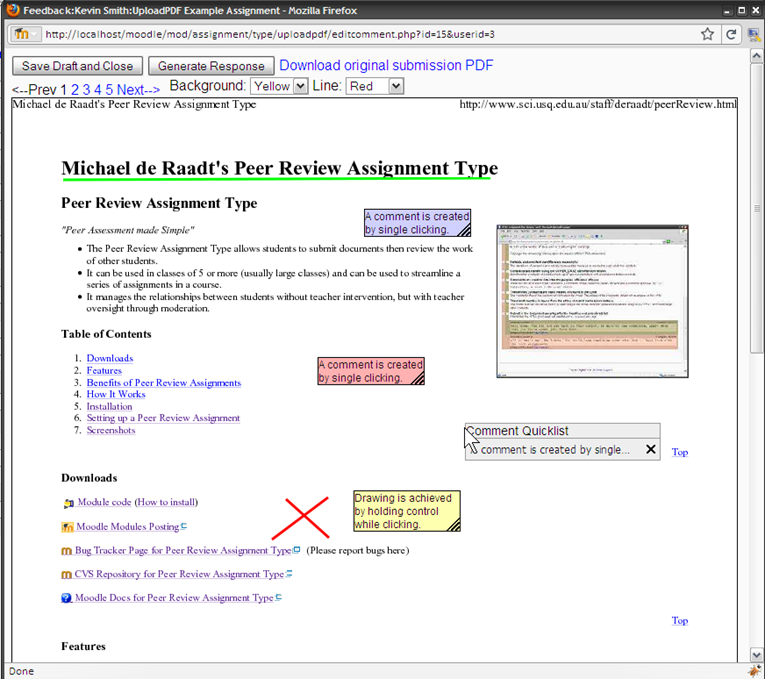
The UploadPDF assignment type allows you to mark and annotate assignments without leaving your browser.The only downside is that students have to upload a PDF document, but that’s not such a big deal any more.


 If you’re waiting for a long period after an interview without hearing any news, it’s probably not a good thing. It doesn’t hurt to call up and ask how the process is going. Put your efforts into other positions after a week or so, if you haven’t already.