Previously I described a number of myths about analytics I saw circulating when I started working in the school sector after years in the tertiary education sector and the education-related IT industry. Some schools are cobbling together reports on a semi-regular basis and, while useful for a small group of people for a short period of time, these are not analytics. Other schools have access to marks from an LMS, but not a complete picture sufficient to make predictions. Analytics should be:
- available on demand,
- predictive and
- proactive.
This means that data should be collected regularly, processed in the background and ready for use, including calculations that lead to simple results as well as complex trends. When a result or trend meets a threshold condition suggesting intervention is warranted, relevant staff members should be notified to act.

Data available to schools
In tertiary education, mandates for online assessment are strong and use of online systems for remote and blended learning are almost universal. This leads to rich data on assessment and other participation that allows tertiary institutions to conduct interventions, with the goal of retaining students (and their fees).
The conditions of data in schools differ to tertiary, with less in some areas and more in others.
| (less) | Schools have less granular online assessment and participation data, with even less in early years. |
| (more) | Student effort is often recorded and can be tracked over time. |
| (more) | School students participate in external assessments. In Australia, students participate in NAPLAN testing in years 3, 5, 7, and 9. |
| (more) | Schools are required to collect attendance information, which can be a useful proxy for participation and when combined with timetable information can reveal rich, useful patterns. |
| (more) | Schools collect pastoral information, which reflects behavior that can impact student outcomes. |
| (more) | Some schools check student attitudes or mood on a regular basis. |
The value of analytics in schools also differs with the goal of improving student outcomes in grades and other holistic measures, rather than just retention.
Data warehouse
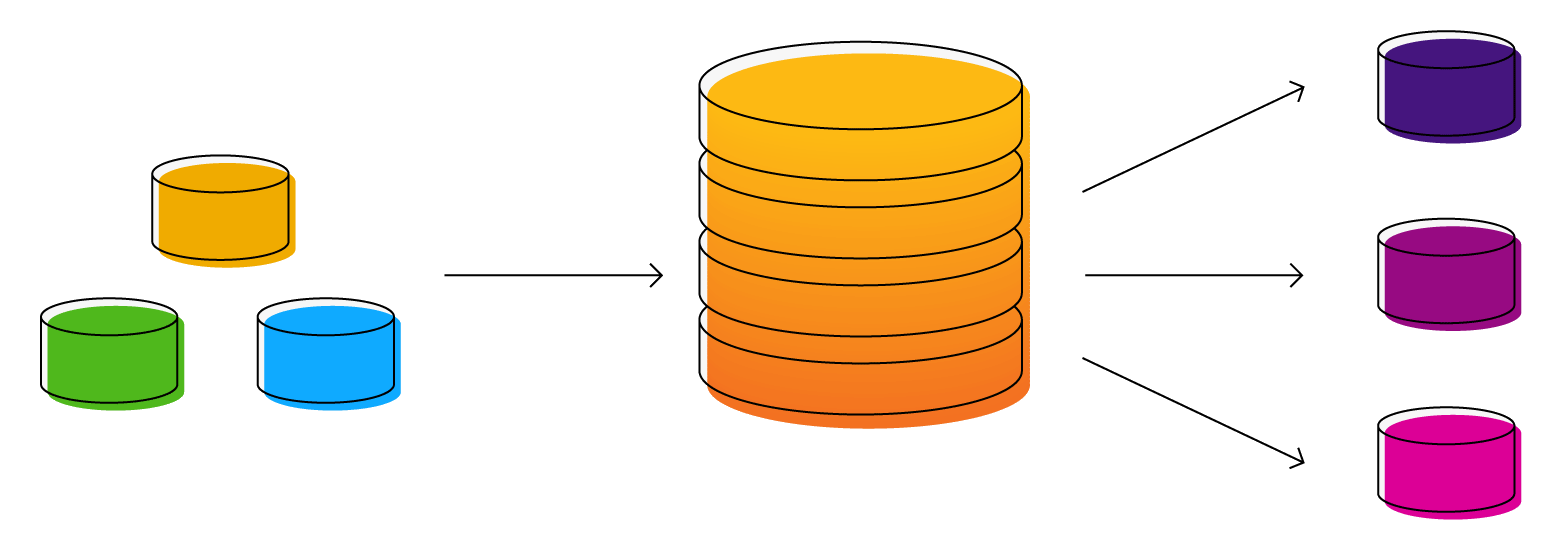
Collecting the data described above is a start, but having the data doesn’t mean it is useful. A data warehouse:
- collects together data from disparate systems (LMS, SIS, forms,…),
- conducts calculations on a regular basis,
- sends alerts when threshold conditions are met and
- provides views that can be queried quickly when people are drawn in to act.
The creation and maintenance of a data warehouse implies the need for data specialist staff. At CGS we are fortunate to have a database administrator, who is primarily responsible for our analytics, as well as a two web devs, a forms dev and a data systems manager, who work together integrating various systems, including the main analytics system referred to as the “Dashboard”.
Analytics possible in schools
Canberra Grammar School had been wanting analytics for a number of years before I joined in 2016, but were unsure how to achieve them. In a project with pastoral and academic leaders, we have been able to develop the Dashboard, which has been in use since 2018 and continues to grow in potential and use.
The development of the Dashboard followed the PMBOK-based project management process that I have written about previously. The need for analytics will differ depending by school and will be driven by the questions that the school needs to answer. This project involved consultation with various pastoral and academic leaders. We captured and expressed questions as use cases, such as “As a teacher/HoSH/Tutor I want an alert for student birthdays”. The list of use cases was quite long and we are still achieving some as more data becomes available.
The platform to handle the analytics could be achieved in a number of systems. At CGS we use SQL Server for the data warehouse (as well as a data store for most of our other systems), SQL Server scheduled tasks for alerts and background processing and a collection of SSRS Reports to form the Dashboard interface. We investigated PowerBI as an alternative platform but found this cost prohibitive when putting the results in the hands of all staff.
Since its inception, the Dashboard has undergone a number of revisions in response to user feedback. The initial focus was on delivering information focussed on individual students. We have added views to allow discovery of students needing intervention within cohorts.
Proactive alerts
Alerts sent directly to users prompt their action, but must be sent sparingly to avoid creating noise that people will habituate to. Here are some examples of alerts sent by email.
- At risk students who have not been marked off in a class
- Students with approved leave needing follow-up
- Unexplained absences over a period of days
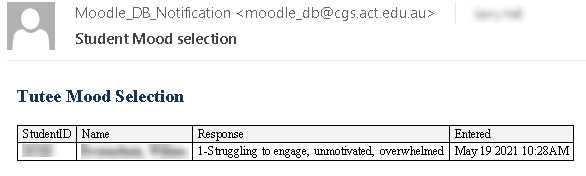
- Students who report their mood as low
- Pastoral events (positive and negative), including detentions
- Reminders to mark assignments
- Reminders to staff to who have not taken class rolls before a certain time in scheduled periods
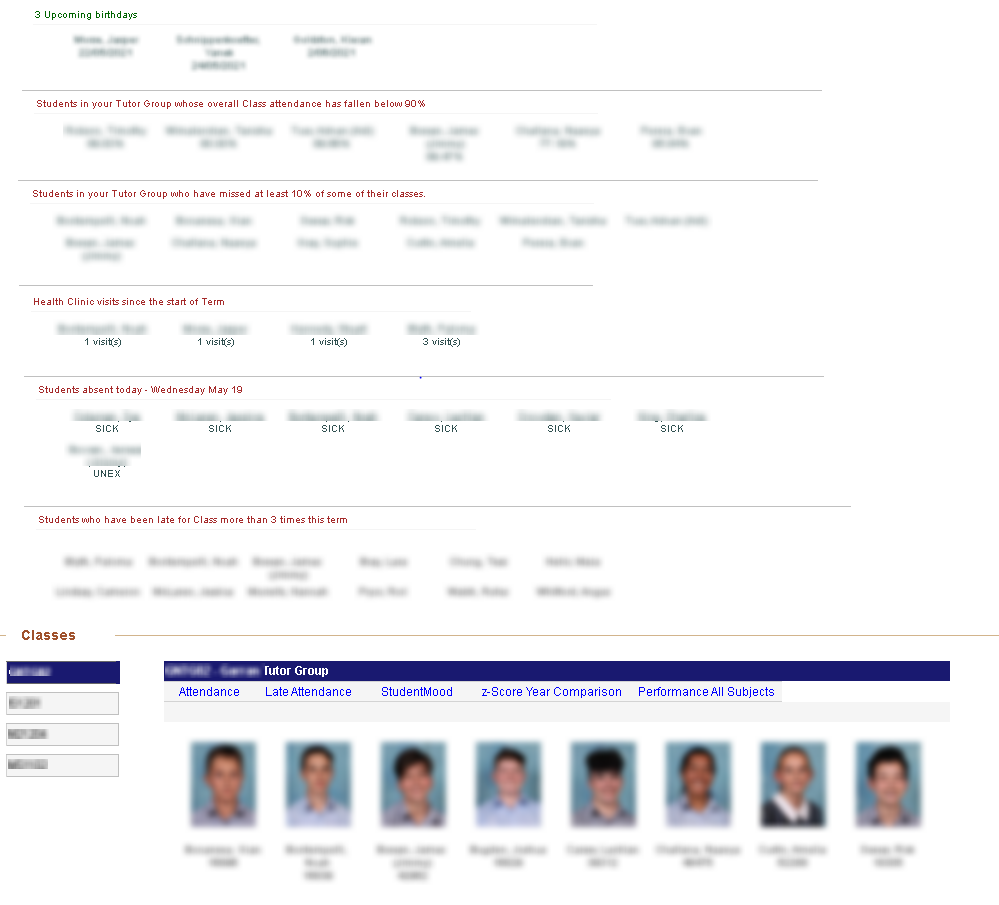
Highlighted information
Some lower-priority alerts are shown to staff on entering the Dashboard. These alerts relate to students whose pastoral care they are responsible for.
- Students with low attendance or lateness
- Students who make numerous visits to health clinic within a period days
- Students with co-curricular activities today
- Student birthdays
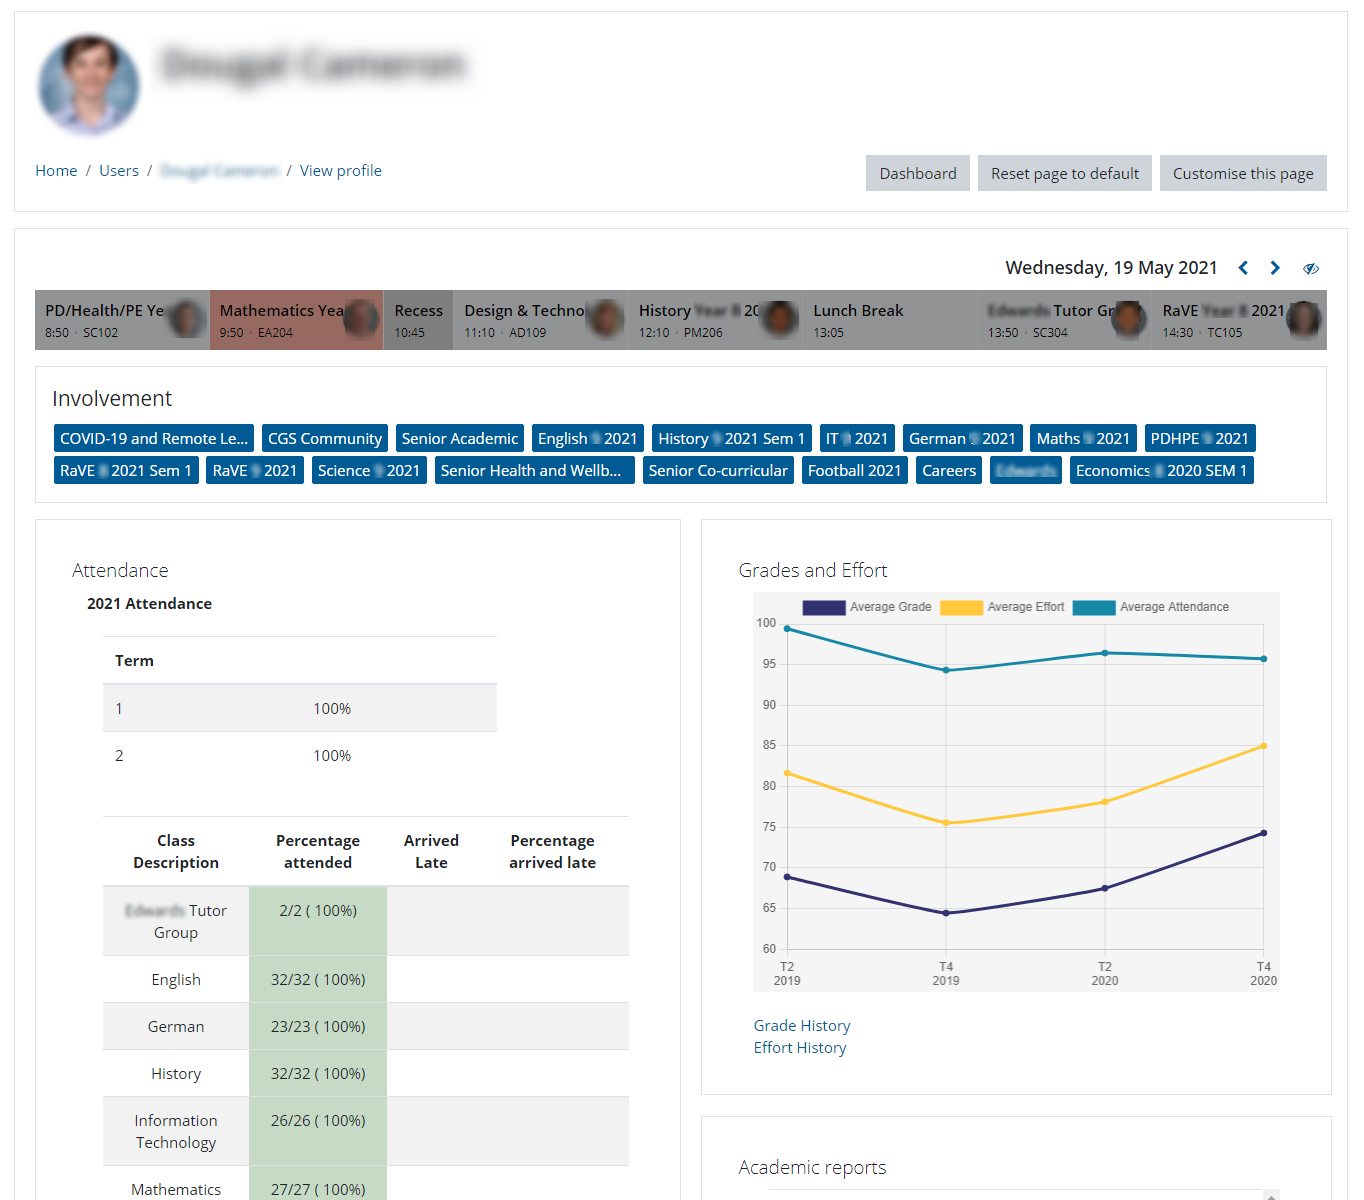
On-demand information
Information displayed on Dashboard
- Academic results and effort marks and trends over the student’s enrolment
- Timetable information and attendance for academic and co-curricular activities
- External assessments results
- Co-curricular participation including weekly activities and carnivals
- Student mood history, pastoral incidents and learning needs
- Cross-reference information for students at risk by matching flags for learning support, medical conditions, etc
Looking at an individual student, a staff member can find information quickly and see highlighted information about the student.
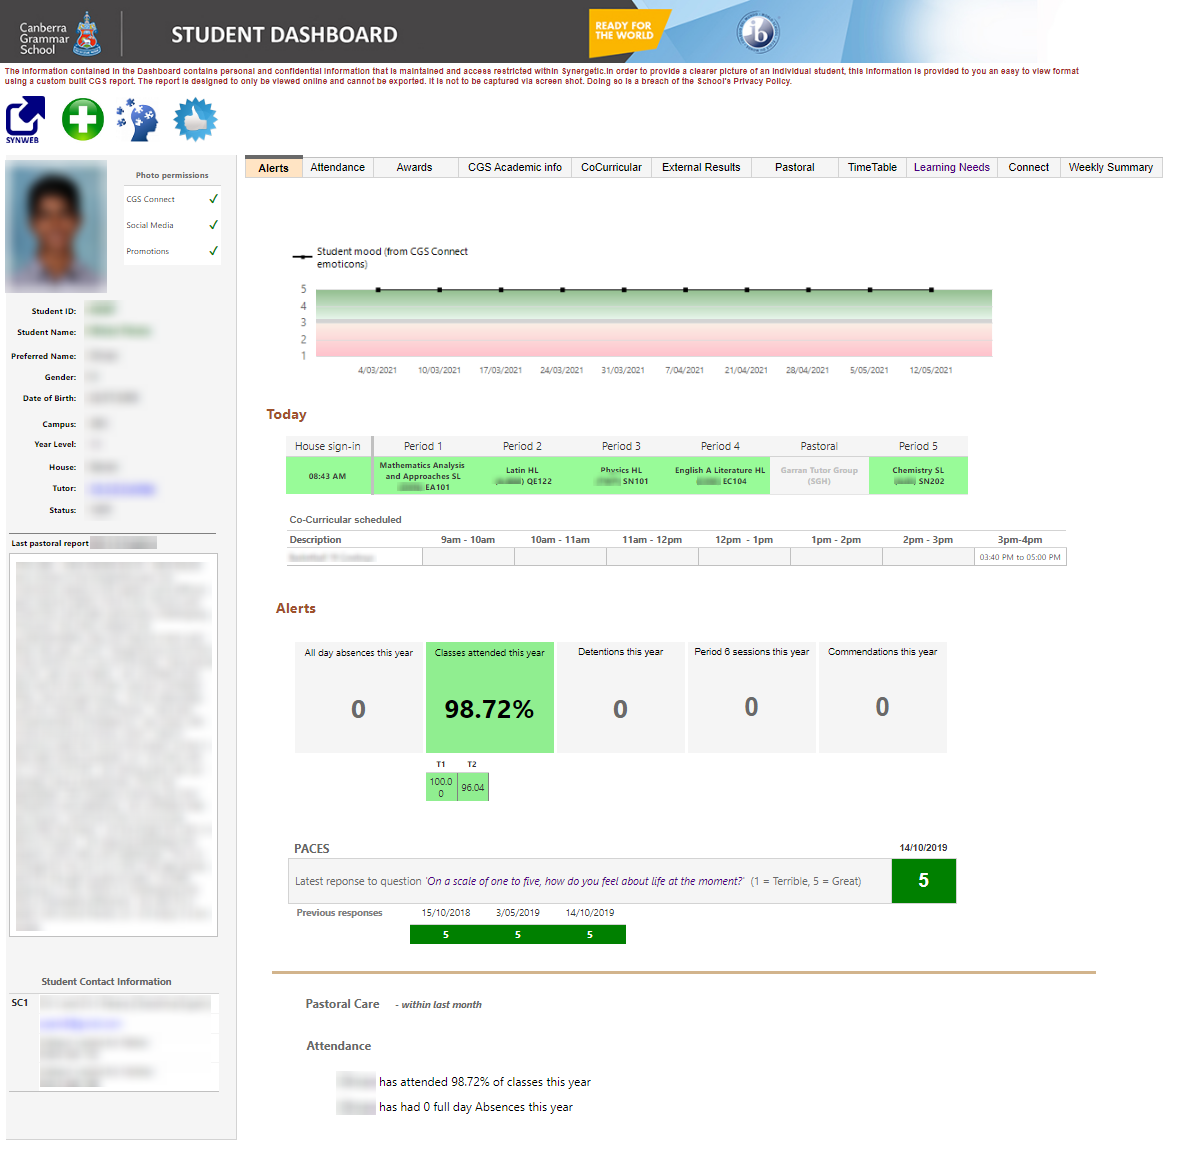
Staff can drill down to specifics.
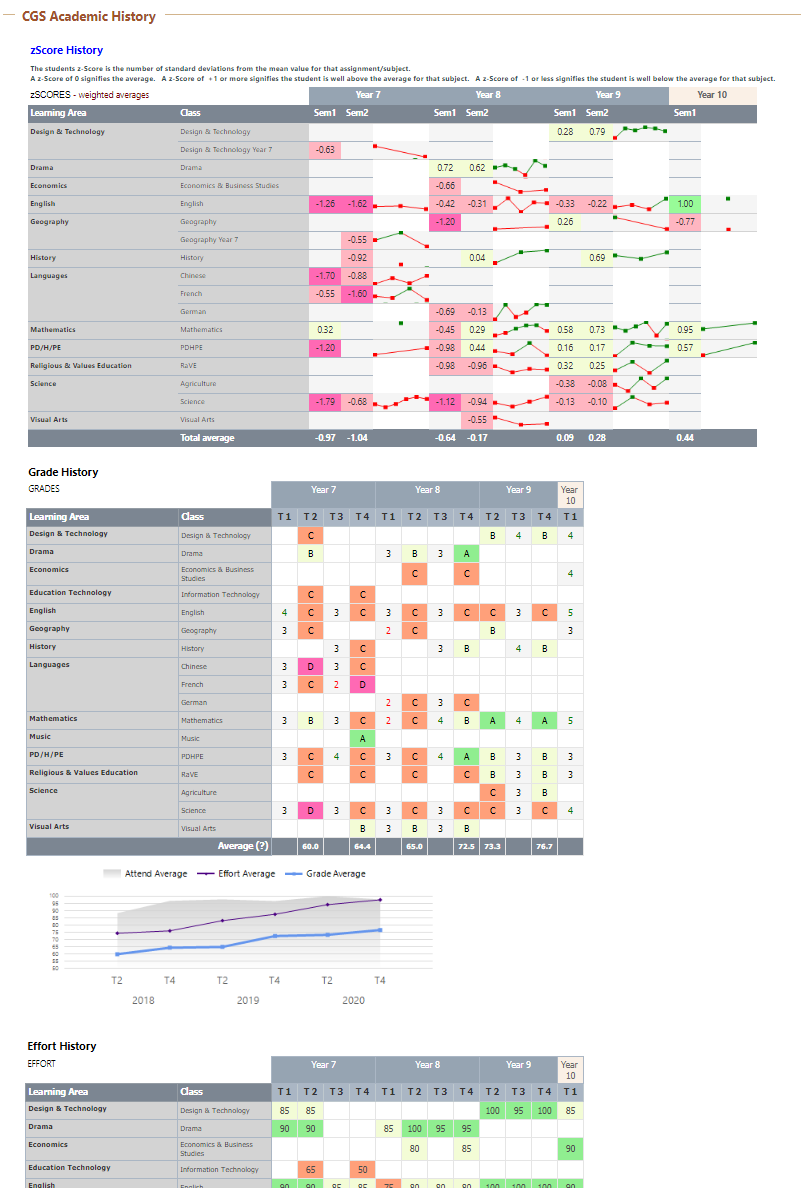
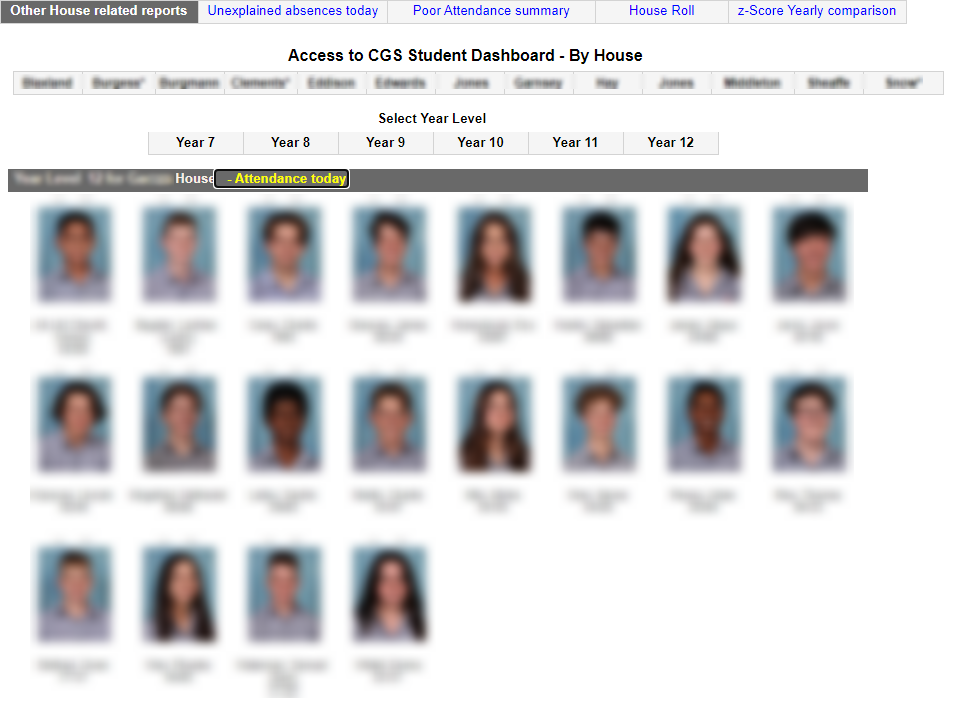
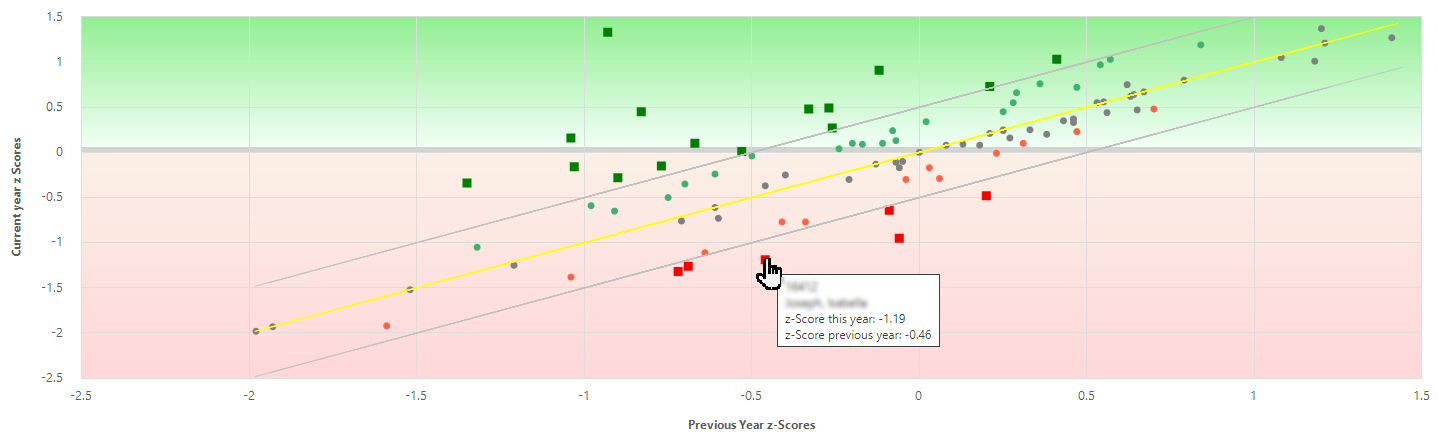
Comparative information and trends
While individual students are presented in the context of their cohort using z-scores, there is also the capacity to look at cohorts of students to identify student performance changes within the cohort.
Usefulness
The success of any system is measured by its usefulness. Analytics at CGS have proven to be useful for more than strategic decision making and seem to be having an impact on student care and to really improve student outcomes. The Dashboard is reported to be used in the following situations.
- Teacher’s understanding who students are at the start of term
- Differentiating students based on:
- ways they learn,
- skill sets and
- past experiences.
- Determining students who will work well together. (One staff member said, “We could spend a whole term getting to know a kid. Now we know them when we walk into the class on day one.”)
- Differentiating students based on:
- Learning Development support
- Report writing
- Pastoral/disciplinary issues
- Following up on students-at-risk
- Following student mood and acting
- Subject choice advice
- Career counselling, uni offers
- Meeting mandatory requirements (eg attendance tracking)
- For administrators to find staff responsible for students
Teachers appreciate the immediacy of having analytics available on-demand. One staff member said “It’s all about efficiency. When you’re reacting, having accurate data presented in an instant means you can assess a situation and make judgements rapidly.”
The use of analytics in the School has emphasised the need for accuracy and consistency in data collection. It is obvious when there are holes in the data, which impacts on the clarity of a picture about a student. This has led to drives for better collection of information and management of staff who fail in their recording duties.
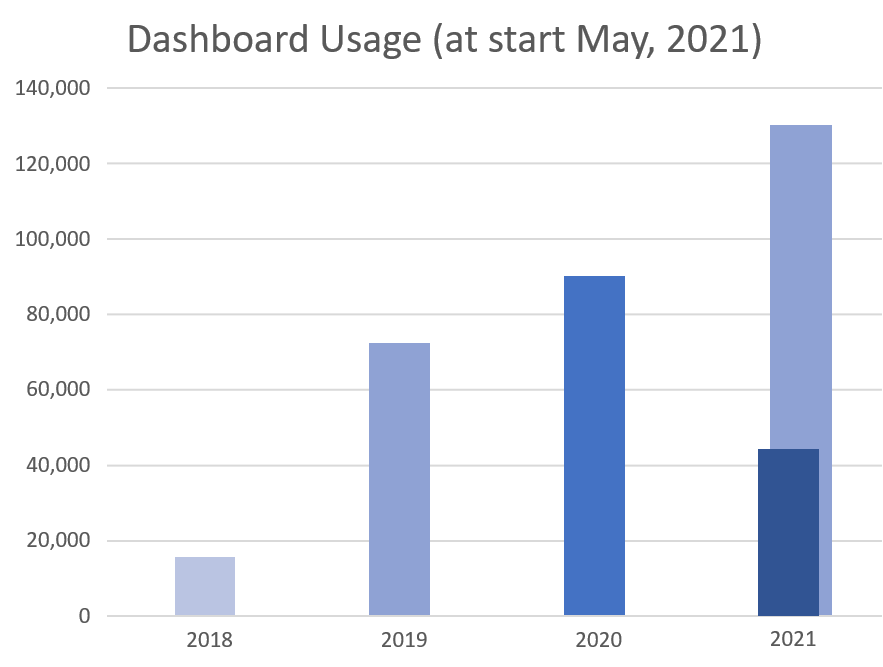
Since the system was introduced, there has been a steady rise in its utilisation, year-on-year. While many staff may have searched in systems that feed data into the Dashboard, it is now clear the Dashboard has become the first interface they go to, particularly for new staff. According to the Director of Student Care, this indicates “staff are using student data in a more holistic way”. Projections for the current year show a number of views over 100,000.
Directions forward
We are still developing more predictive analytics. We are working on micro-patterns of attendance, such as a student missing classes in a particular subject. With a drive to bring most assessment to our Learning Management System in all parts of the School, this will give more granular data and hopefully the ability to reach the holy grail of analytics, which is predicting student success within a current course.
With greater access to data, staff can feel they might be missing out on information, particularly as the system evolves. Specific training and encouraging practitioner sharing has become needed to train data-driven teachers and pastoral leaders. This need is increasing.
We are currently working on parent and student views of analytics as a form of continuous assessment information. This informational display will be presented through the School’s LMS.
One thought on “Real Analytics in a K-12 School”