At recent school level (K-12) ed-tech conferences I’ve witnessed a larger than expected amount of fear-mongering, prognostication and exaggeration. There’s also been a great number of presentations about analytics, pronouncing as “here now” or impending many data-related technologies that are arguably not achieved. I thought it was worthwhile scrutinising some of these claims.
My critique is likely to become outdated in the near future (at least I hope it will) but is intended to be a general reflection of the state of analytics in schools in 2017.
Myth 1: “We have analytics”
I have seen a number of people claiming student-data-related reports are analytics. What defines analytics is the analysis of trends, usually relating to behaviours, to allow prediction. I would also add that the point of analytics is to promote proactive responses. Anything less than this is simply a report, regardless of how many graphs are included.
Myth 2: “Build it and they will come”
Another claim I have noted is the prediction that, with “analytics” in hand (or more accurately reports as I have seen), teachers will transform education. Simply providing more information to time-poor educators is unlikely to encourage change.

Where analytics have the potential to encourage positive change in education is through highlighting where action is needed and prompting teachers to undertake that action. Analytics tools need to be following trends silently in the background, incorporating new information as it becomes available, making predictions and proactively prompting action when thresholds are passed.
Myth 3: “We have too much data”
As the technology of analytics filters down from the Web to higher education and towards schools, some of the rhetoric about “big data” is naturally transmitted along with those ideas. However, in schools, there is not really a large number of rich data streams to be compared.

In higher education analytics are employed to track participation and submissions, primarily to determine “students at risk” as it relates to drop-outs and also to placement funding. Student activity in higher education is focused on activity in LMSs where most document sharing and assessment takes place. It is a focused, rich source of behavioural data.
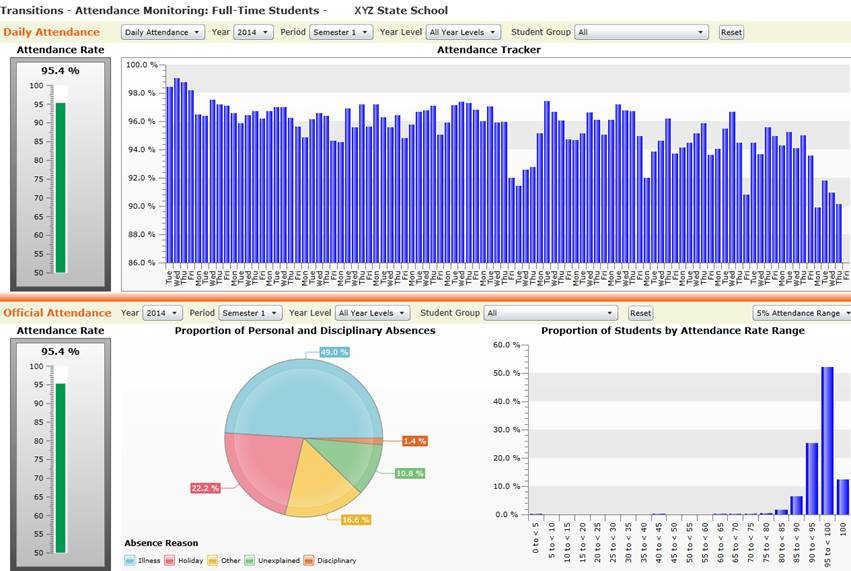
In schools, blended learning will remain a focus for the foreseeable future. Also, the purpose of analytics in schools is more about improving student outcomes. The set of data streams is quite different at these earlier years of education. Attendance is the richest source of data, but even that is prone to errors and anomalies. Some schools have LMSs, but utilisation varies, making it difficult to compare students or even focus on a single student across courses. Common assessment information tends to be summative and describes learning across periods such as terms or semesters, not days or weeks. In order for analytics to be feasible, schools need to mandate more frequent points of electronic assessment and additional streams of information need to be added, such as pastoral and attitudinal information.
Ultimately, I think we still have a way to go.
Hi Michael
Shelly Grist here, still at usq, I’m about to start PhD Take 2 with a focus on building real data analytics to help time poor teachers and students focus their time where its most needed. Would really appreciate your input. Please get in touch if you’re interested. Thanks!
I agree that providing teachers with actionable insights is crucial.